
In Formula 1, DNF and DNS statistics play an important role in understanding driver reliability and team performance. This page provides detailed data on how often drivers fail to finish races or are unable to start, helping fans analyze season trends and overall consistency in Formula 1.
DNF (Did Not Finish) and DNS (Did Not Start) statistics provide crucial insight into:
- Driver reliability
- Team performance
- Race consistency
From 2000 to 2026, this data highlights how often drivers fail to finish races and reveals how reliability has evolved in modern Formula 1.
#
Driver
Team
DNF/DNS
DNF Rate
Races
🥇
Aston Martin
82
19.2%
426 (344 finished)
🥈
Brawn Mercedes
76
24.8%
306 (230 finished)
🥉
Renault
74
35.4%
209 (135 finished)
4
McLaren Mercedes
73
20.8%
351 (278 finished)
5
Minardi
60
27.8%
216 (156 finished)
6
Audi
55
20.4%
269 (214 finished)
7
Lotus F1
53
29.3%
181 (128 finished)
8
Ferrari
52
30.2%
172 (120 finished)
9
Williams
48
19.4%
247 (199 finished)
10
Renault
48
26.2%
183 (135 finished)
11
BMW Sauber
46
15.3%
300 (254 finished)
12
Cadillac
46
15.5%
297 (251 finished)
13
Sauber Ferrari
44
34.4%
128 (84 finished)
14
Red Bull Renault
43
27.6%
156 (113 finished)
15
Sauber
43
16.0%
268 (225 finished)
16
Aston Martin
42
20.5%
205 (163 finished)
17
HRT
41
16.0%
256 (215 finished)
18
Williams BMW
40
30.8%
130 (90 finished)
19
Sauber BMW
38
38.0%
100 (62 finished)
20
Ferrari
38
9.6%
395 (357 finished)
21
HRT Cosworth
38
42.7%
89 (51 finished)
22
Red Bull
37
14.9%
248 (211 finished)
23
McLaren Mercedes
36
19.5%
185 (149 finished)
24
Ferrari
36
17.1%
211 (175 finished)
25
Cadillac
34
13.0%
261 (227 finished)
26
Lotus Mercedes
33
34.4%
96 (63 finished)
27
Super Aguri Honda
33
37.5%
88 (55 finished)
28
Ferrari
32
17.8%
180 (148 finished)
29
Williams
32
15.5%
206 (174 finished)
30
Williams BMW
31
33.7%
92 (61 finished)
31
Ferrari
30
16.0%
188 (158 finished)
32
Sauber Petronas
30
50.8%
59 (29 finished)
33
Alpine F1 Team
30
15.5%
193 (163 finished)
34
Williams
29
20.1%
144 (115 finished)
35
Toyota
29
43.9%
66 (37 finished)
36
HRT Cosworth
29
36.3%
80 (51 finished)
37
Haas F1 Team
27
13.8%
195 (168 finished)
38
Toro Rosso
24
21.4%
112 (88 finished)
39
Jaguar Cosworth
24
49.0%
49 (25 finished)
40
Lotus Renault
24
21.4%
112 (88 finished)
41
Caterham Renault
24
31.6%
76 (52 finished)
42
Sauber Ferrari
24
24.7%
97 (73 finished)
43
Mercedes
22
13.2%
167 (145 finished)
44
Minardi Cosworth
22
44.0%
50 (28 finished)
45
Spyker Ferrari
19
42.2%
45 (26 finished)
46
Marussia Cosworth
19
20.7%
92 (73 finished)
47
McLaren
18
10.8%
167 (149 finished)
48
STR Ferrari
18
32.7%
55 (37 finished)
49
Racing Bulls
18
15.5%
116 (98 finished)
50
HRT Cosworth
16
31.4%
51 (35 finished)
51
Haas Ferrari
15
25.4%
59 (44 finished)
52
STR Renault
15
25.9%
58 (43 finished)
53
Williams Renault
14
30.4%
46 (32 finished)
54
Prost Acer
14
41.2%
34 (20 finished)
55
Williams Mercedes
14
14.3%
98 (84 finished)
56
HRT Cosworth
13
28.3%
46 (33 finished)
57
Williams Mercedes
13
21.3%
61 (48 finished)
58
Caterham Renault
13
22.4%
58 (45 finished)
59
Williams BMW
12
60.0%
20 (8 finished)
60
STR Ferrari
12
42.9%
28 (16 finished)
61
McLaren Honda
12
19.0%
63 (51 finished)
62
STR Ferrari
11
23.9%
46 (35 finished)
63
Renault
11
29.7%
37 (26 finished)
64
McLaren Mercedes
11
32.4%
34 (23 finished)
65
Renault
11
39.3%
28 (17 finished)
66
Caterham Renault
10
25.6%
39 (29 finished)
67
Minardi Cosworth
10
55.6%
18 (8 finished)
68
Virgin Cosworth
10
52.6%
19 (9 finished)
69
Force India Mercedes
10
17.2%
58 (48 finished)
70
Toyota
10
45.5%
22 (12 finished)
71
Alfa Romeo Ferrari
10
14.7%
68 (58 finished)
72
Williams Toyota
9
27.3%
33 (24 finished)
73
Toyota
9
56.3%
16 (7 finished)
74
Scuderia Toro Rosso
9
36.0%
25 (16 finished)
75
Jaguar Cosworth
9
52.9%
17 (8 finished)
76
Minardi Cosworth
9
56.3%
16 (7 finished)
77
Williams Mercedes
9
25.0%
36 (27 finished)
78
Toyota
9
28.1%
32 (23 finished)
79
Super Aguri Honda
8
38.1%
21 (13 finished)
80
Toyota
8
29.6%
27 (19 finished)
81
Arrows Cosworth
8
80.0%
10 (2 finished)
82
Jordan Ford
8
57.1%
14 (6 finished)
83
Marussia Cosworth
8
23.5%
34 (26 finished)
84
Williams Toyota
8
22.2%
36 (28 finished)
85
Williams BMW
8
40.0%
20 (12 finished)
86
McLaren
8
9.4%
85 (77 finished)
87
MRT Mercedes
8
20.5%
39 (31 finished)
88
STR Ferrari
8
29.6%
27 (19 finished)
89
Minardi Cosworth
8
40.0%
20 (12 finished)
90
Alfa Romeo Racing
7
11.3%
62 (55 finished)
91
Sauber Ferrari
7
17.5%
40 (33 finished)
92
Racing Bulls
7
14.0%
50 (43 finished)
93
Haas F1 Team
7
16.7%
42 (35 finished)
94
HRT Cosworth
7
33.3%
21 (14 finished)
95
MF1 Toyota
7
19.4%
36 (29 finished)
96
Minardi Asiatech
6
54.5%
11 (5 finished)
97
Audi
6
15.4%
39 (33 finished)
98
Minardi Fondmetal
6
35.3%
17 (11 finished)
99
Minardi Cosworth
6
54.5%
11 (5 finished)
100
Sauber Petronas
6
37.5%
16 (10 finished)
101
Jordan Ford
6
42.9%
14 (8 finished)
102
Mercedes
5
12.8%
39 (34 finished)
103
Alpine
5
11.9%
42 (37 finished)
104
Red Bull
5
13.9%
36 (31 finished)
105
Haas Ferrari
5
11.6%
43 (38 finished)
106
Haas Ferrari
5
23.8%
21 (16 finished)
107
Super Aguri Honda
4
57.1%
7 (3 finished)
108
Caterham Renault
4
21.1%
19 (15 finished)
109
Lotus Renault
4
36.4%
11 (7 finished)
110
Lotus Renault
3
15.0%
20 (17 finished)
111
Marussia Ferrari
3
8.6%
35 (32 finished)
112
MRT Mercedes
3
25.0%
12 (9 finished)
113
RBR Ferrari
3
27.3%
11 (8 finished)
114
Williams Mercedes
3
14.3%
21 (18 finished)
115
Marussia Ferrari
3
16.7%
18 (15 finished)
116
Super Aguri Honda
3
75.0%
4 (1 finished)
117
Alpine F1 Team
2
28.6%
7 (5 finished)
118
Williams Mercedes
2
18.2%
11 (9 finished)
119
Racing Bulls
1
6.7%
15 (14 finished)
120
Marussia Ferrari
1
7.7%
13 (12 finished)
121
Marussia Ferrari
0
0.0%
5 (5 finished)
122
Williams Mercedes
0
0.0%
1 (1 finished)
123
Ferrari
0
0.0%
2 (2 finished)
124
Jaguar Cosworth
0
0.0%
1 (1 finished)
125
Minardi Cosworth
0
0.0%
5 (5 finished)
126
Haas Ferrari
0
0.0%
2 (2 finished)
What Do DNF and DNS Mean in F1?
- DNF (Did Not Finish): Driver started but failed to finish due to crashes, mechanical failures, or retirements
- DNS (Did Not Start): Driver did not start the race despite being entered
These metrics are essential for analyzing true performance beyond wins and podiums
Drivers with Most DNFs (2000–2026)
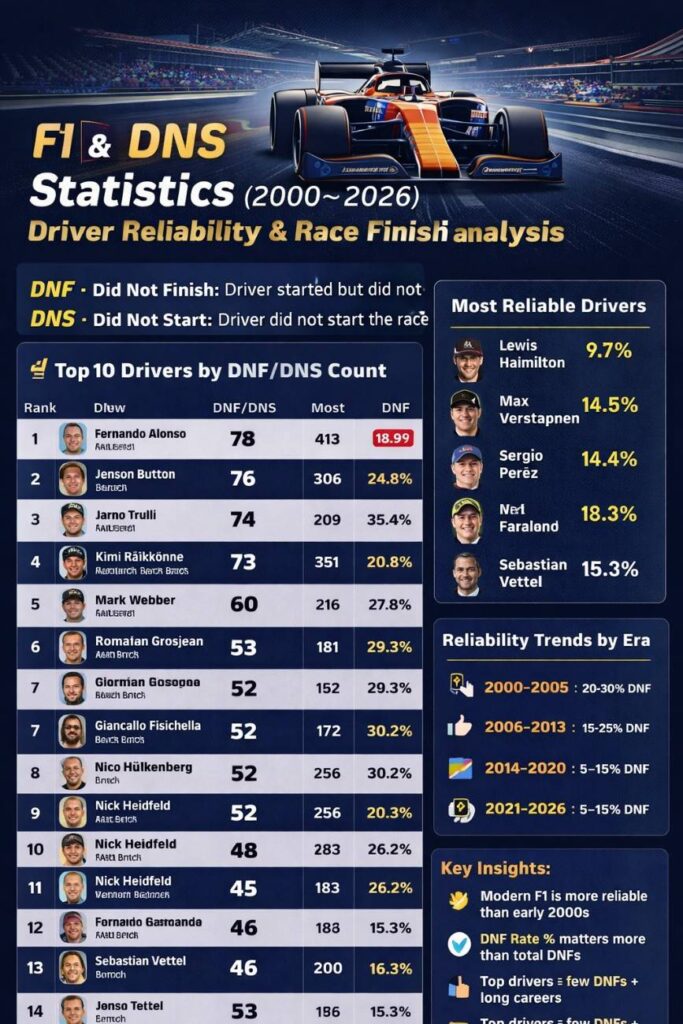
Top 10 Drivers by DNF/DNS Count
| Rank | Driver | DNF/DNS | Races | DNF Rate |
|---|---|---|---|---|
| 1 | Fernando Alonso | 78 | 413 | 18.9% |
| 2 | Jenson Button | 76 | 306 | 24.8% |
| 3 | Jarno Trulli | 74 | 209 | 35.4% |
| 4 | Kimi Räikkönen | 73 | 351 | 20.8% |
| 5 | Mark Webber | 60 | 216 | 27.8% |
| 6 | Romain Grosjean | 53 | 181 | 29.3% |
| 7 | Giancarlo Fisichella | 52 | 172 | 30.2% |
| 8 | Nico Hülkenberg | 52 | 256 | 20.3% |
| 9 | Nick Heidfeld | 48 | 183 | 26.2% |
| 10 | Sebastian Vettel | 46 | 300 | 15.3% |
Key Insight: More Races = More DNFs
At first glance, drivers like Fernando Alonso and Kimi Räikkönen appear to have high DNF counts.
But this is mainly because:
- They have long careers
- More races = higher total DNFs
DNF Rate (%) is the real metric to judge reliability
Most Reliable Drivers (Lowest DNF Rate)
Among top drivers:
- Lewis Hamilton – 9.7% DNF rate
- Max Verstappen – 14.5% DNF rate
- Sergio Pérez – 14.4% DNF rate
These drivers show exceptional consistency and strong team reliability
Drivers with High DNF Rates
Some drivers struggled with reliability:
- Pedro de la Rosa – 42.7%
- Jacques Villeneuve – 38.0%
- Jarno Trulli – 35.4%
Often due to:
- Weaker teams
- Mechanical failures
- Shorter or unstable careers
Era-Based Reliability Trends
Early 2000s (2000–2005)
- High DNF rates
- Frequent mechanical failures
- Less reliable engines
Mid Era (2006–2013)
- Gradual improvement
- Better engineering
- Fewer race retirements
Hybrid Era (2014–2020)
- Major reliability improvement
- Fewer DNFs
- Teams like Mercedes dominated consistency
Modern Era (2021–2026)
- Reliability at its peak
- Most DNFs now caused by:
- Collisions
- Strategy decisions
- Racing incidents
Driver Comparison: Reliability vs Longevity
| Driver | Races | DNF Rate | Insight |
|---|---|---|---|
| Alonso | 413 | 18.9% | Long career, strong consistency |
| Hamilton | 382 | 9.7% | Elite reliability |
| Verstappen | 235 | 14.5% | Modern consistency |
| Vettel | 300 | 15.3% | Balanced performance |
What Causes DNFs in Formula 1?
1. Mechanical Failures
- Engine issues
- Gearbox problems
2. Race Incidents
- Crashes
- Contact with other drivers
3. Strategy Decisions
- Retirements to save engine parts
4. Weather Conditions
- Wet races increase DNF probability
Key Insights from the Data
- Modern F1 is far more reliable than early 2000s
- High DNF counts don’t mean poor performance
- DNF rate (%) is the best measure of consistency
- Top drivers combine:
- Low DNF rate
- High race count
Frequently Asked Questions (FAQ)
What is a DNF in Formula 1?
A DNF means the driver started the race but did not finish.
What is DNS in Formula 1?
DNS means the driver did not start the race.
Which driver has the most DNFs?
Fernando Alonso has one of the highest counts due to his long career.
Which driver is most reliable?
Lewis Hamilton has one of the lowest DNF rates among top drivers.
Has F1 reliability improved over time?
Yes, modern Formula 1 cars are significantly more reliable than earlier eras.
Summary
This comprehensive Formula 1 statistics breakdown analyzes DNF (Did Not Finish) and DNS (Did Not Start) figures across the history of the sport, helping fans understand how often retirement and non-starts occur and what they reveal about driver consistency, team reliability, and era-by-era performance. In Formula 1 race result sheets, DNF indicates a driver who started but failed to finish the race, often due to collisions, mechanical issues, or strategic retirements, while DNS shows a driver who did not take the race start despite qualifying or being entered — usually because of pre-race technical problems or accidents. DNF and DNS trends highlight how modern F1 reliability has dramatically improved compared to earlier decades, with most retirements now stemming from on-track incidents rather than mechanical breakdowns. These statistics also show which drivers and teams have the most finishes and which have struggled historically with retirements, giving deeper context beyond podiums and wins.
F1 Stats Last Updated: September 30, 2026 | All statistics, lap times, and driver comparisons on this page reflect the most current data available from the official F1 sources. And updated till the last race which happened in 30 SEP 2026